Ecommerce Contribution Margin: Why Break-Even ROAS Changes for Every Order

A Shopify campaign is above your break-even ROAS. It looks safe to scale.
Then you open the orders behind the number. One customer used a 10% abandoned-cart discount. Another bought two products together, but that order left less profit. Shipping ran high, a refund arrived the following week, and payment fees took another cut.
The ad platform may have calculated the revenue correctly. The mistake was giving every order the same break-even target even though the costs were different.
Shopify teams often calculate break-even ROAS once and keep using it. That only works while the real costs match the original calculation. Change the discount, product mix, shipping, payment fee, refund rate, or customer type, and you need a different target.
Contribution margin gives you the missing view. It shows how much money is left after the costs required to sell and deliver the order. CM3 takes that one step further by including marketing cost, so you can see what remains before overhead.
What is ecommerce contribution margin?
It is the money left after subtracting the variable costs tied to selling and fulfilling an order.
For a Shopify store, those costs usually include:
- Cost of goods sold (COGS)
- Discounts
- Shipping and fulfillment
- Packaging and pick-and-pack fees
- Payment processing fees
- Returns and refunds
- Ad spend, depending on which profit level you are calculating
The basic formula is:
Contribution margin = net revenue - variable costs
The formula belongs in a finance report, but the answer changes a growth decision:
Was this order worth acquiring?
A $150 order is not automatically better than a $100 order. The $150 order may contain a heavily discounted bundle, expensive products, and higher fulfillment costs. The $100 order may be a full-price hero SKU with a much healthier margin.
Revenue tells you how large the order was. Contribution margin tells you what it left behind.
Shopify's contribution-margin guide draws the same line between revenue and what remains after variable costs. Growth teams need that calculation at order and campaign level.
CM1, CM2, and CM3 in plain language
CM1, CM2, and CM3 are different layers of contribution margin. Each layer subtracts more costs.
The naming is not completely standardized across ecommerce tools and finance teams. One dashboard may include shipping in CM2, while another subtracts it in CM3. Before comparing numbers, check which costs each layer includes.
The basic idea stays the same:
CM1: did the product itself make money?
CM1 starts with net revenue and subtracts product cost.
CM1 = net revenue - COGS
If CM1 is already weak, paid growth has very little room to work. A product with a 30% gross margin cannot support the same acquisition cost as a product with a 70% gross margin.
CM2: what did the order leave after order-level costs?
CM2 usually subtracts costs such as shipping, fulfillment, packaging, payment fees, discounts, returns, and refunds.
CM2 is where a healthy-looking product can become an unattractive order. The product margin may be fine, but selling and delivering the order eats the room that looked available.
CM3: what remains after marketing?
CM3 includes acquisition or marketing cost as well. At Venon, the dashboard's CM3 bridge connects net revenue with COGS, marketing costs, transaction fees, and shipping fees.
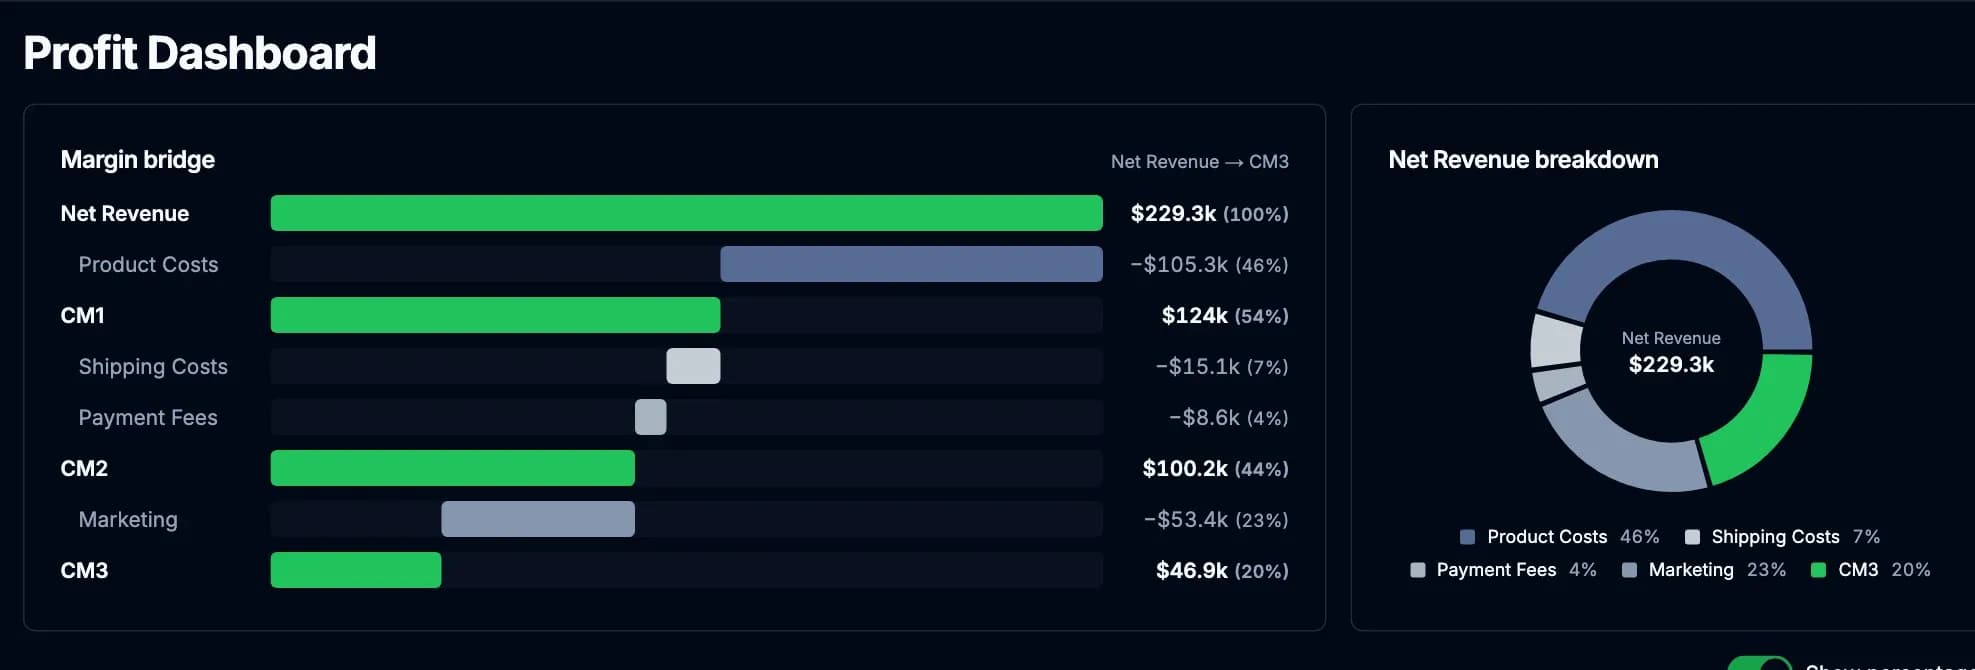
Daniel's simplest description is the useful one:
CM3 is the profit you made before all the overhead costs.
The business still needs to pay salaries, software, rent, agencies, contractors, and other fixed expenses from what remains.
A store can grow revenue and still feel tight on cash. More sales do not help if each new order leaves too little CM3 to support the company.
Hypothetical $100 order
How revenue becomes CM3
CM3 is what remains before fixed overhead such as salaries, software, rent, and retainers.
How to calculate break-even ROAS from contribution margin
Break-even ROAS is the point where the money left before ads is just enough to cover the ad cost.
A simple formula is:
Break-even ROAS = net revenue / contribution before ad spend
You can also calculate it as:
Break-even ROAS = 1 / contribution margin percentage before ad spend
If an order has a 50% contribution margin before ads, its break-even ROAS is 2.0x. If that margin drops to 40%, break-even ROAS rises to 2.5x.
Most teams can do the formula. The mistake is feeding it store averages that do not match the order they are judging.
Start with one order. A $100 order with a $10 discount leaves $90 in net revenue. Subtract $35 for product cost, $9 for shipping and fulfillment, and $3 for payment fees. That leaves $43 before ads. If the customer cost $50 to acquire, the order loses $7 even though the sale looked normal in the revenue dashboard.
Here are three more hypothetical Shopify orders:
| Order scenario | Net revenue | COGS | Shipping, fulfillment and payment fees | Contribution before ads | Break-even ROAS |
|---|---|---|---|---|---|
| Full-price single product | $100 | $35 | $11 | $54 | 1.85x |
| Same product with 10% recovery discount | $90 | $35 | $11 | $44 | 2.05x |
| Lower-margin two-product bundle | $150 | $75 | $15 | $60 | 2.50x |
Hypothetical Shopify order examples.
Same examples, different targets
Lower margin pushes break-even ROAS higher
Full-price product
54% before ads
10% recovery discount
49% before ads
Lower-margin bundle
40% before ads
The bundle has the highest AOV. It also needs the highest ROAS to break even.
A universal 1.85x target would approve all three orders. The discounted order and the bundle would still lose money at that level.
The dashboard says break-even because the dashboard received the wrong break-even line.
Break-even ROAS is not one fixed number
A single break-even target is useful for quick campaign checks. It becomes dangerous when it replaces a proper look at the costs and profit from the actual orders.
The target changes when any of these inputs change:
- Discount rate
- SKU or variant
- Bundle composition
- Product cost
- Shipping destination or method
- Payment provider
- Return or refund rate
- New versus returning customer mix
- First-order versus lifetime payback window
A 10% Klaviyo abandoned-cart offer may recover a sale that would otherwise be lost. It also reduces net revenue while COGS and fulfillment stay largely unchanged, so the full-price break-even target overstates how much ad spend that order can support.
Bundles can lift AOV and still lower contribution margin. The extra product may have weaker margin, add a picking fee, increase package weight, or trigger a more expensive shipping bracket.
Store-wide averages are useful estimates, not approval for every order that crosses the line.
ROAS vs POAS: why revenue can look good while profit gets worse
ROAS divides the revenue claimed by an ad platform by ad spend. That makes it useful for reading campaign movement, but it cannot tell you whether the sale made money.
POAS means profit on ad spend. It replaces attributed revenue with the profit left after the costs behind those orders. For budget decisions, that is usually the number you were trying to get from ROAS in the first place.
| Metric | What it tells you | What it misses |
|---|---|---|
| ROAS | Revenue returned per ad dollar | Product cost, shipping, fees, refunds, and discounts |
| POAS | Profit returned per ad dollar | It only works when cost inputs are complete |
ROAS and POAS answer different questions.
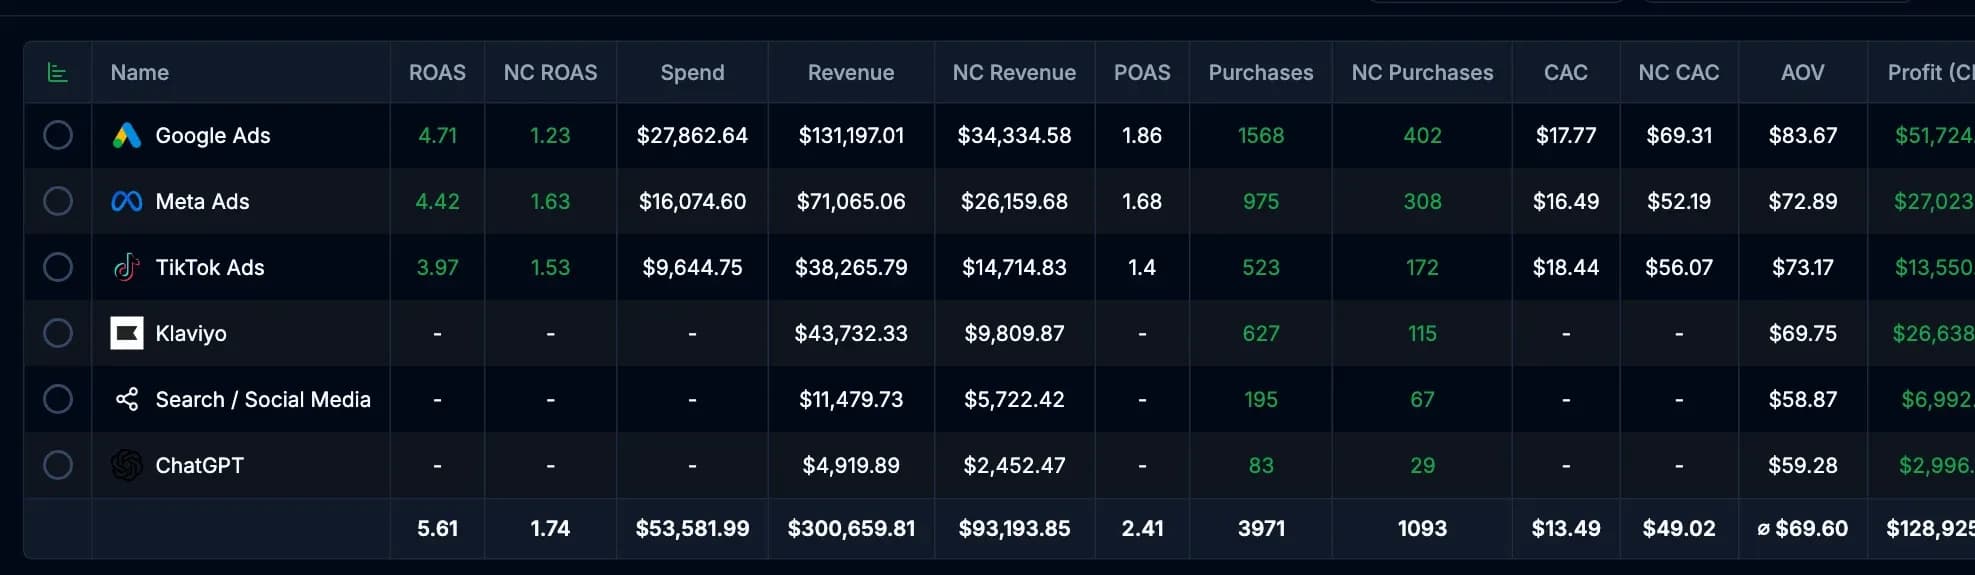
Two campaigns can report 2.5x ROAS and produce different profit. One sells a full-price, high-margin hero product to new customers. The other catches returning customers with a discount on a lower-margin product. Meta reports the same ROAS for both, but the budget decision should not be the same.
Attribution adds another problem. Meta, Google, email, and an analytics tool may each claim influence over one purchase. POAS and contribution margin bring the decision back to the economics of the order the store actually received.
| Situation | What it means | Decision |
|---|---|---|
| High ROAS, low POAS | Revenue looks good, profit is weak | Do not scale yet |
| Low ROAS, high POAS | Platform reporting looks weak, but orders are profitable | Investigate before cutting |
| High ROAS, high POAS | Revenue and profit agree | Candidate to scale |
| Low ROAS, low POAS | Weak demand and weak economics | Fix offer, product, or channel |
Use POAS and contribution margin before changing budget.
Google Ads' target ROAS guide explains how conversion value is compared with spend. The store still has to decide whether that value means revenue or profit.
Meta's business help center covers platform reporting. For analytics-product differences, see Venon's guides to Triple Whale alternatives and Hyros alternatives.
Day-one ROAS and revenue LTV can lie in both directions
A campaign does not always need to be profitable on day one. Future value still has to be measured in profit.
Taking a small loss on the first order can make sense for a subscription, replenishment product, low-entry trial, or strong post-purchase funnel. The condition is simple: later orders must produce enough profit to cover that loss within 30 or 90 days.
Without that evidence, future value is a hopeful line in the forecast. The second order may never arrive, churn may run high, or repeat purchases may depend on another aggressive discount.
Day-one numbers can mislead the other way too. D1 ROAS looks acceptable, but the order relies on low-margin products, expensive fees, or returning demand the ad platform claimed again.
Revenue LTV can hide the same problem. A customer with $300 in lifetime revenue and a $100 CAC looks healthy at 3:1. If the brand keeps only 30% after variable costs, that customer produced $90 before overhead against $100 of acquisition cost.
Why revenue LTV can mislead
$300 in lifetime revenue can still lose money
Lifetime revenue
$300
Profit before overhead
$90
Result before overhead
−$10
Compare lifetime profit with CAC. A revenue-to-CAC ratio can hide a loss.
Choose the payback window from observed buying behavior:
- Use first-order contribution margin for products with little repeat behavior.
- For products with repeat purchases, check how much profit the customer has created after 30 or 90 days.
- Track subscription retention and cancellation instead of assuming recurring revenue will continue.
- Compare lifetime profit with CAC, not lifetime revenue with CAC.
Longer payback means more cash and execution risk.
Recovered Klaviyo orders can improve payback from traffic you already paid to acquire, but discounted recovery orders still need to be judged using their actual contribution margin. See our Shopify abandoned-cart recovery guide for the recovery mechanics.
Small cost changes become large profit changes
Many profit leaks start outside Ads Manager. Carrier rates, tariffs, heavier bundles, payment fees, and refunds can all change the cost of an order.
A $2 cost increase sounds small. Across 20,000 orders, it removes $40,000 before overhead.
$2 extra cost per order
Small cost leaks scale quickly
Impact shown before fixed overhead. The same cost increase also lowers the CAC you can afford.
These costs also change the CAC the business can afford. If contribution before ads falls from $54 to $50, the old acquisition target is no longer accurate.
Quarterly spreadsheet reviews are too slow for costs that change the acquisition target today. Product costs, shipping rules, payment fees, discounts, and returns need to sit close to the growth decision.
Timing can hide the leak. A refund posted two weeks after a sale may miss last week's campaign report. A shipping surcharge may affect one country, while a fee change hits one gateway. Store averages blur both problems.
A weekly profit view should expose those changes before the team raises or cuts spend.
What Shopify operators should do when margin is weak
A weekly review does not need dozens of charts. It needs a sensible order, starting with the store and ending with payback.
Start with the whole store:
- Total ad spend compared with store revenue (MER), and total acquisition cost per customer
- POAS alongside ROAS, so profit and revenue are not treated as the same return
- Net revenue rather than gross sales
- New-customer CPA and NC ROAS
- New versus returning customer share
Then check whether the orders made money:
- Contribution margin by SKU and bundle
- Discount usage
- Shipping and fulfillment cost
- Payment fees
- Refund and cancellation rate
- First-order CM3
Finally, check payback:
- D30 or D90 contribution margin where repeat purchase matters
- Lifetime profit to CAC
- Profit from recovered Klaviyo and SMS orders
- Repeat rate by first-purchase product
A weak-looking Meta campaign may be buying new customers with strong payback. A great-looking one may be harvesting returning demand or pushing low-margin bundles.
Do not scale either one from ROAS alone.
When contribution margin is weak, lowering CPA is only one possible fix. Check discounting, low-margin SKUs, shipping changes, bundle economics, returning-customer credit, and weak POAS hidden behind ROAS.
Check profit before increasing ad spend
Venon connects attribution with POAS, CM3, CAC, MER, new-customer performance, product costs, shipping profiles, and payment fees. Book a demo to see it with your store's cost inputs.
How Venon approaches profit-first reporting
Most attribution dashboards lead with revenue and channel ROAS. Venon keeps those metrics, then adds POAS so merchants can see what the attributed orders left after costs.
Profit Tracking is fully rolled out in Venon. Merchants can configure product costs, shipping profiles, payment fees, returns, and other order costs, then use those inputs in POAS, CM3, and break-even reporting. The dashboard also shows ROAS, CAC, MER, NC MER, AOV, new-customer purchase share, and the CM3 bridge.
It puts two questions in the same report: "Which campaign received credit?" and "Did the resulting orders make money?"
That makes the budget review faster.
There is an important limit. If product costs or shipping rules are incomplete, the contribution-margin calculation is incomplete too. With the costs configured, a founder can inspect the same profit calculation across channels, products, and customer groups before moving budget instead of rebuilding it in a spreadsheet after every campaign review.
A practical CM3 decision workflow
When a campaign looks ready to scale, work through the order in this sequence:
- Start with net revenue.
- Separate new and returning customers.
- Apply COGS at SKU or variant level.
- Subtract discounts, shipping, fulfillment, payment fees, refunds, and returns.
- Compare contribution before ads with CAC.
- Calculate CM3 before overhead.
- If repeat purchase matters, compare lifetime profit with CAC over the actual payback window.
- Review attribution before assigning the result to one channel.
Campaign review sequence
From order data to a budget decision
- 1
Revenue and customer type
Start with net revenue. Separate new and returning customers.
- 2
Product and order costs
Apply COGS, discounts, shipping, fulfillment, fees, refunds, and returns.
- 3
Ads and CM3
Compare contribution before ads with CAC, then calculate CM3.
- 4
Payback and attribution
Check lifetime profit where relevant, then verify which channel deserves credit.
After those checks, answer one question:
After all the costs, did these orders leave enough money to be worth acquiring?
If the answer is yes, the campaign may deserve more budget. If it is no, check beyond Ads Manager. The problem could be the discount, bundle, shipping, product mix, attribution, or acquisition cost.
Each of those problems needs a different fix. A higher ROAS target alone will not tell you which one you have.
FAQ
What is ecommerce contribution margin?
Ecommerce contribution margin is what remains after selling and delivery costs. Depending on the profit level, that includes COGS, discounts, shipping, fulfillment, payment fees, returns, refunds, and marketing spend.
What is CM3 in ecommerce?
CM3 remains after product, order, and marketing costs but before fixed overhead such as salaries, software, rent, and retainers. Check each tool's cost classification before comparing it.
Is break-even ROAS fixed?
No. Discounts, product mix, bundles, COGS, shipping, fees, returns, and customer type can all change contribution margin and move the break-even point.
Why can a bundle increase AOV but reduce profitability?
Because the extra products can bring lower margin, higher COGS, pick-and-pack fees, or more expensive shipping. Check contribution margin and revenue per visitor, not AOV alone.
Should Shopify brands use ROAS or contribution margin?
Both. ROAS helps you read campaign efficiency. Contribution margin tells you whether the revenue was worth acquiring after variable costs.
Should a campaign be profitable on the first order?
It depends on cash and repeat buying. Measured repeat purchases may support a 30-day or 90-day payback target. Products with few repeat orders need profit up front. Future value counts when later orders produce it.
How does Klaviyo recovery affect contribution margin?
It can improve payback by converting demand from traffic the brand already paid for. If the flow uses a discount, calculate margin from the discounted order, not the full-price target.
Contribution margin makes ROAS useful again
ROAS is useful when its target reflects the orders behind it. One break-even line assumes every order shares the same margin, discount, shipping, fees, refund risk, and customer type. A Shopify store rarely behaves that neatly.
Contribution margin shows those differences. CM3 tells you what the order or campaign left before overhead after selling, delivering, and acquiring it.
Finance and marketing can both use that number. The media buyer keeps ROAS and CPA. The founder sees whether orders leave enough for payroll, software, inventory, and more growth.
Healthy CM3 gives you room to scale. Weak CM3 tells you that a good-looking campaign is making the business tighter, not stronger.
See profit after ads and order costs
Want to review your Shopify growth through contribution margin instead of platform ROAS alone? Book a Venon demo and see how CM3, attribution, new-customer performance, and cost inputs come together.